Top prop trading performance metrics for consistent results
TradeDupe
13 min read
Optimize your trading with top prop trading performance tracking metrics. Discover essential metrics for consistent results in multi-account strategies.
Managing multiple funded accounts simultaneously is one of the most operationally demanding challenges in modern prop trading. When you layer automated trade duplication on top of that, the data can multiply fast, and without the right performance tracking metrics in place, you risk making decisions based on incomplete or misleading information. This article breaks down which metrics matter most for prop traders operating on Tradovate, how to evaluate them against each other, and how to turn raw tracking data into disciplined, risk-controlled trading decisions across every account you run.
Table of Contents
- Key criteria for selecting performance tracking metrics
- Top metrics for tracking prop trading performance
- Comparison of tracking metrics for multi-account automation
- Best practices for actionable reporting and risk control
- Beyond benchmarks: What most prop traders miss about performance tracking
- Level up your prop trading metrics with TradeDupe
- Frequently asked questions
Key Takeaways
| Point | Details |
|---|---|
| Track more than just P&L | Metrics like drawdown and Sharpe ratio reveal risk and consistency, not just profits. |
| Choose automation-friendly metrics | Select metrics that can be updated in real-time and tracked across all your duplicated accounts efficiently. |
| Turn metrics into actionable steps | Use your performance data to make timely adjustments and maintain funder compliance. |
| Beware the illusion of correlation | Duplicated trades don’t always perform identically—track results at both macro and micro levels. |
| Leverage the right tools | Tools like TradeDupe can simplify, automate, and enhance your prop trading performance tracking. |
Key criteria for selecting performance tracking metrics
Not every metric deserves a place on your dashboard. The first step is knowing what separates a useful tracking measure from one that just adds noise.
When evaluating a metric for multi-account prop trading, especially when using automated trade duplication, look for these core qualities:
- Transparency: The metric should produce a clear, unambiguous number. If two traders calculate it differently, it creates confusion rather than clarity.
- Real-time updating: In live trading, stale data is dangerous. The best metrics update with every fill, not just at end of day.
- Cross-account compatibility: When you're duplicating trades across several accounts, you need metrics that can aggregate or compare data at both the individual account and portfolio level.
- Risk visibility: A good metric should expose both your profit potential and your exposure to drawdown or violation thresholds.
- Customizability: Scalpers need different benchmarks than swing traders. Metrics should flex to fit your specific strategy.
One common mistake traders make is tracking everything. Fifteen metrics on a screen can paralyze decision-making just as effectively as having none. The trading evaluation process for most prop firms already narrows the field, focusing on drawdown limits, consistency, and profit targets. Use that framework as a filter.
When managing trading funded accounts, it's also important to recognize that some metrics matter more during evaluation phases versus active funded trading. Compliance-relevant metrics like maximum daily loss and trailing drawdown should always be front and center, while alpha-generating metrics can be weighted more heavily once you're consistently funded.
According to key financial indicators for prop traders, the industry standard for drawdown limits is settling around 3% daily and 6% to 8% overall in 2026, making real-time drawdown tracking non-negotiable for any serious prop operation.
Pro Tip: Before adding a metric to your tracking setup, ask one question: "Will this change a decision I make today?" If the answer is no, deprioritize it.
With criteria defined, we can break down the most essential metrics for prop traders using Tradovate and automated trade duplicators.
Top metrics for tracking prop trading performance
There are dozens of numbers you could track. These are the ones that consistently deliver actionable signal across both evaluation and funded trading phases.
- Profit and loss (P&L), absolute and percentage: This is the baseline. Absolute P&L tells you raw dollar value, while percentage P&L normalizes across accounts of different sizes. For multi-account setups, percentage P&L is more useful for comparison. Watch both daily and cumulative views.
- Maximum drawdown: This measures the largest peak-to-trough equity drop in a given period. It's the metric most prop firms use to trigger account violations. If your maximum drawdown is creeping toward your firm's limit, that's a red flag that demands immediate attention, not a note for your weekend review.
- Average drawdown: Often overlooked, average drawdown tells you what a typical losing stretch looks like. A low average drawdown paired with a sudden spike in maximum drawdown can indicate a one-off event or a breakdown in strategy discipline.
- Win rate: The percentage of trades that close profitable. On its own, win rate is almost meaningless. A 70% win rate means nothing if your average loser is three times your average winner. Always analyze win rate alongside risk/reward ratio.
- Risk/reward ratio: This defines the relationship between your average winning trade and your average losing trade. A 1:2 risk/reward means you're targeting twice what you risk. Even a 40% win rate can be profitable with a strong risk/reward profile.
- Consistency score: Most prop firms evaluate this as the ratio of your best trading day's profit to your total profit. A consistency score above a certain threshold, often 30% to 40%, can disqualify you from payouts under prop firm consistency rules. This metric is critical for automated duplication, because a single large trade copied across five accounts can spike your consistency ratio in ways you won't catch without real-time monitoring.
- Sharpe ratio: This risk-adjusted return measure divides your average return by the standard deviation of returns. A Sharpe ratio above 1.0 is generally considered acceptable; above 2.0 is strong. It's particularly useful for comparing strategies or accounts running different setups.
> "Tracking performance metrics with real examples shows that traders who monitor at least five core metrics simultaneously make significantly better risk-adjusted decisions than those relying on P&L alone."
For reliable execution across multiple accounts, your metrics need to capture not just outcomes but execution quality. Slippage between the lead account and follower accounts, for example, can distort your win rate and average P&L figures in ways that only become visible when you compare account-level data side by side.
You can explore performance tracking strategies that align closely with prop firm evaluation standards to see how these metrics translate in practice.

Pro Tip: Set a weekly review block where you compare your Sharpe ratio and consistency score across all accounts. Divergence between accounts often signals execution lag or an account-specific risk event you need to address.
Now let's explore these top metrics, detailing how each can be leveraged for actionable trading improvements.
Comparison of tracking metrics for multi-account automation
With individual metrics defined, let's see how they stack up against each other for automated, multi-account setups.
| Metric | Real-time capable | Multi-account compatible | Automation-friendly | Compliance relevance |
|---|---|---|---|---|
| Absolute P&L | Yes | Yes | High | Medium |
| Percentage P&L | Yes | Yes | High | Medium |
| Maximum drawdown | Yes | Yes | High | Very high |
| Average drawdown | Partial | Yes | Medium | Medium |
| Win rate | Yes | Yes | High | Low |
| Risk/reward ratio | Yes | Yes | Medium | Low |
| Consistency score | Partial | Yes | Medium | Very high |
| Sharpe ratio | Partial | Yes | Low | Low |
A few takeaways stand out from this comparison. Maximum drawdown and consistency score are the highest compliance relevance metrics, which makes them the most urgent to monitor in real time. Win rate and percentage P&L are easiest to automate and compare across accounts. Sharpe ratio requires more historical data to be meaningful, making it better suited to weekly or monthly reviews than real-time alerts.
For consistency rule insights specific to your prop firm, always verify which metrics trigger evaluation failures. Different firms weight drawdown and consistency rules very differently, so your tracking setup should mirror the firm's own evaluation criteria.
Where common blind spots emerge when using trade copiers:
- Execution lag distortion: A 34ms replication delay is negligible in most conditions, but during high-volatility events like CPI releases or FOMC announcements, even short delays can produce materially different fills across accounts. This distorts per-account P&L and win rate comparisons.
- Position sizing mismatches: If follower accounts have different buying power than the lead account, a fixed-contract copy can create disproportionate risk exposure in smaller accounts. Metrics should be normalized by account size, not just raw dollar figures.
- Aggregated vs. per-account data: Looking only at aggregated metrics masks account-level issues. One account might be approaching its drawdown limit while the aggregate dashboard looks healthy.
The financial firms monitoring performance of proprietary trading activities emphasize that granular, per-account visibility is what separates professional operations from amateur ones. The aggregate view is useful for portfolio-level decisions, but account-level data is what protects you from surprise violations.
Use the profit calculator tool to cross-reference expected returns with real-time P&L data, helping you catch discrepancies early before they compound into compliance issues. You can also review metrics with real examples to benchmark your own numbers against practical trading scenarios.
Best practices for actionable reporting and risk control
Now, let's translate this knowledge into a checklist of hands-on actions for prop traders aiming to level up their reporting and control risk.
- Set metric-based alerts, not just visual dashboards. Watching a dashboard is passive. Configure alerts that trigger when maximum drawdown hits 50%, 75%, and 90% of your limit. The same approach applies to daily loss limits and consistency score thresholds.
- Review drawdown data in layers. Don't just track the number; track the sequence. Three consecutive days of drawdown approaching your limit is a more serious signal than one isolated spike. Sequence data tells you whether you're trending toward a violation or experiencing noise.
- Adjust trade size based on evolving metrics. If your Sharpe ratio drops below 1.0 over a rolling 20-day period, that's a signal to reduce position size until performance stabilizes. Master capital allocation principles suggest that dynamic sizing, tied to real-time metric performance, consistently outperforms fixed-size approaches.
- Schedule formal metric reviews. Daily monitoring catches emergencies. Weekly reviews identify trends. Monthly reviews inform strategy decisions. Structure your review cadence to match the time horizon of each decision type.
- Use a trading journal tied to your metric data. Numbers without context lose meaning over time. When your win rate drops, being able to reference specific market conditions, trade setups, or execution changes helps you diagnose root causes faster.
| Review cadence | Key metrics to assess | Decision type |
|---|---|---|
| Daily | Max drawdown, daily P&L, daily loss limit | Risk control, account safety |
| Weekly | Win rate, consistency score, Sharpe ratio | Strategy performance review |
| Monthly | Cumulative P&L, avg drawdown, risk/reward | Capital allocation, scaling |
For funded account strategies that span multiple firms and platforms, consistency in how you define and calculate each metric is as important as the metrics themselves. If one account uses a trailing drawdown and another uses a static drawdown, your aggregated maximum drawdown figure can be deeply misleading.
Refer to a trading glossary to standardize terminology across your team or operation. When multiple traders or account managers are reading the same dashboard, shared definitions prevent dangerous miscommunications.
Smart payout management tips also underscore the importance of tracking metrics around payout windows. Withdrawing profits at the right time relative to your drawdown cycle can meaningfully change your risk profile going forward.
Pro Tip: Build a simple one-page metric summary for each account that you review before every trading session. Knowing exactly where each account stands relative to its limits before you place a single order is one of the highest-leverage habits you can build.
Beyond benchmarks: What most prop traders miss about performance tracking
All the best practices aside, there is a more fundamental issue that most traders quietly struggle with: they measure what's easy, not what's predictive.
P&L is easy to measure. So is win rate. These are the footprints left by large market movements that are already behind you. But the metrics that actually predict whether your system is degrading or strengthening tend to be subtler, and most traders never look at them closely enough.
Consider outlier trade adjustment. One exceptional trade, whether a home-run winner or a catastrophic loser, can distort your average return in ways that mask the true performance of your system. Removing outliers and reviewing your "core" P&L, the results without the top and bottom 5% of trades, gives you a more honest picture of repeatable edge. Most traders never calculate this.
There's also what we'd call the illusion of correlation in trade duplication. When you replicate trades across five accounts, the accounts look correlated because they are. But liquidity conditions differ by account size, broker routing, and time of fill. Two accounts copying the same lead order can produce meaningfully different results during illiquid sessions or volatile news events. If you're only looking at aggregate metrics, that divergence stays hidden until one account trips a drawdown limit you didn't see coming.
Execution process metrics matter more than most traders acknowledge. Small things like fill latency, the gap between signal and execution, and average slippage per trade are as predictive of long-term account health as headline P&L. A trade copier for prop firms that minimizes execution lag and provides per-account fill data gives you the raw material to track these process metrics. Without that visibility, you're essentially flying on instruments you can only read after landing.
Finally, trust in your tracking method determines whether you actually stick to your trading plan under pressure. Traders who believe their metrics are accurate and timely make better behavioral decisions during drawdowns. Those who doubt their data tend to override their systems at exactly the wrong moment. Invest in tools and setups that give you confidence in your numbers, because that confidence is itself a performance asset.
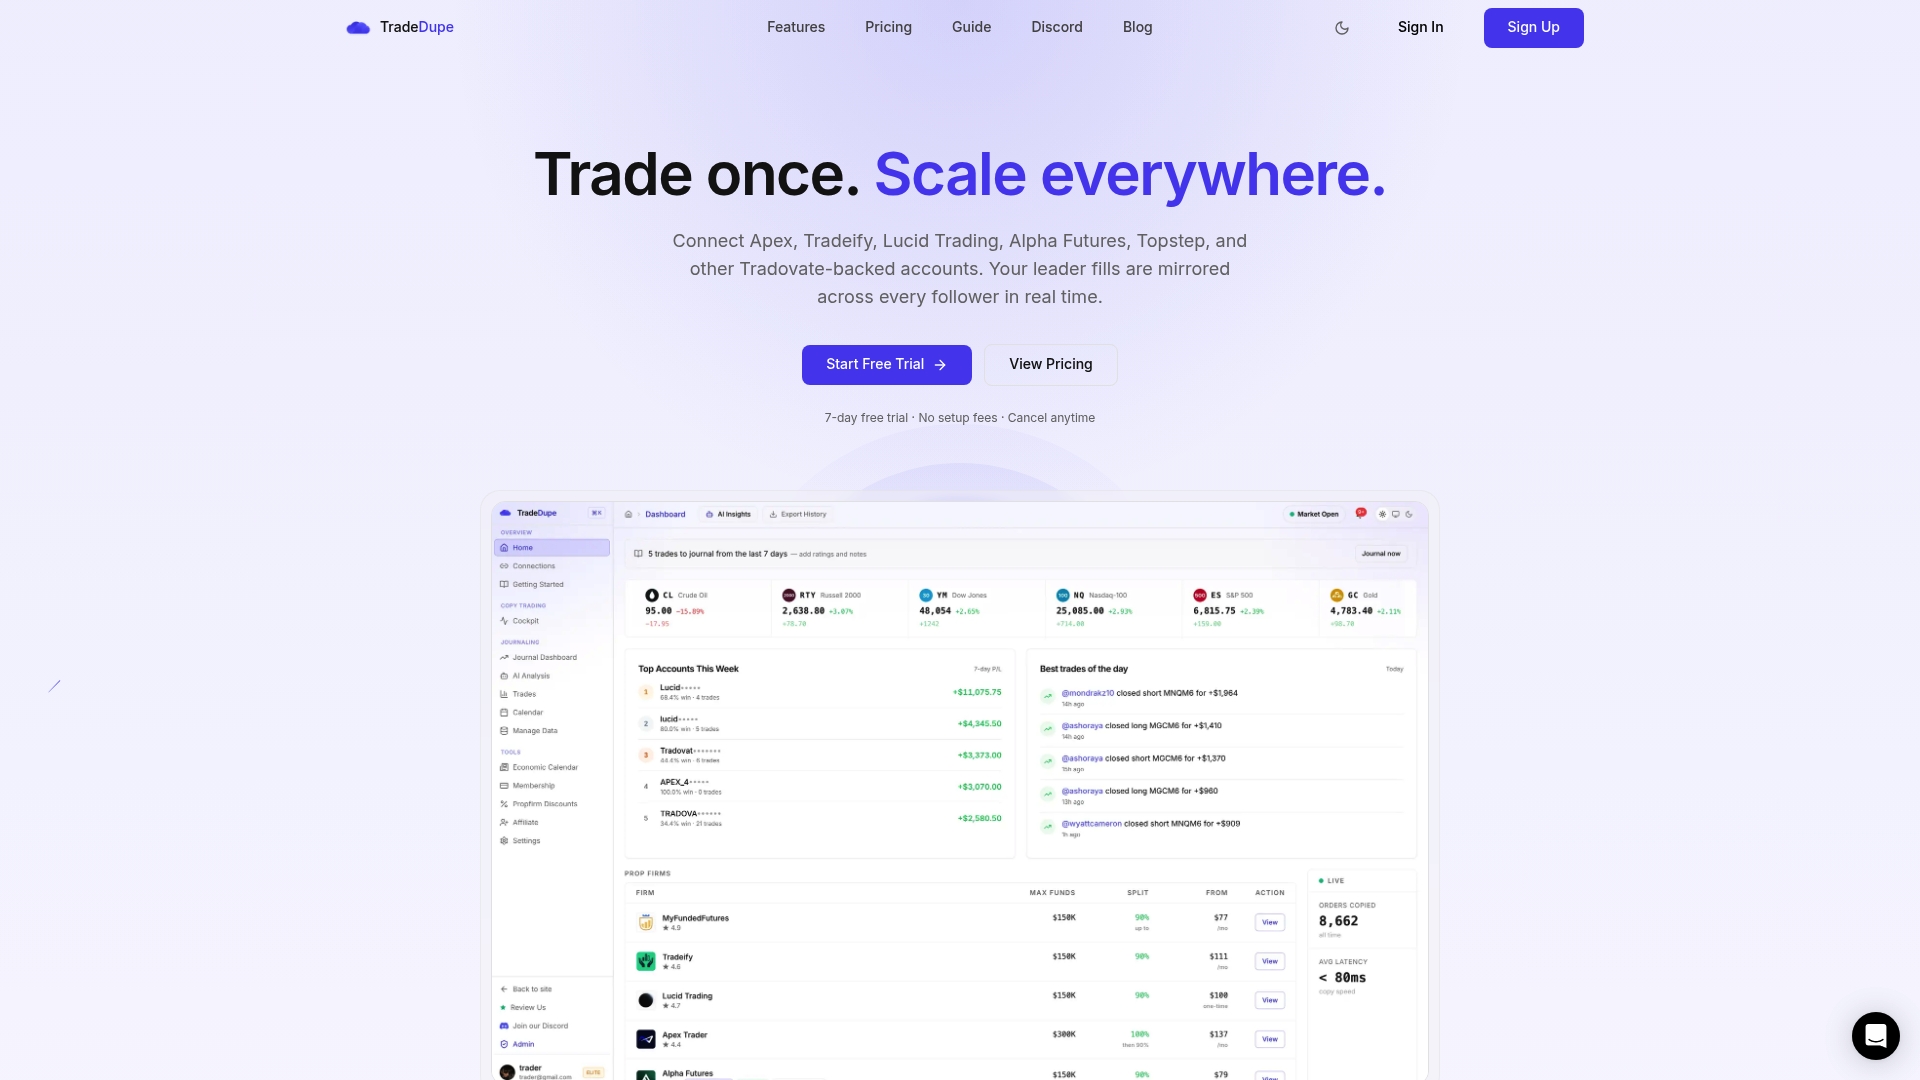
Level up your prop trading metrics with TradeDupe
Ready to put these best practices to work? Here's how TradeDupe helps you track, improve, and automate your prop trading performance with confidence.
TradeDupe is purpose-built for prop traders running multiple Tradovate accounts who need more than a basic dashboard. From real-time sync monitoring to per-account toggle controls, the platform gives you the granular visibility this article describes.
Whether you're managing an Apex copy trading setup or running a full multi-firm operation through the Tradovate trade copier, TradeDupe's analytics layer surfaces the metrics that matter most, from consistency score tracking to execution lag monitoring, all in one place. Use the prop firm profit calculator to model your risk and return scenarios before scaling. If you're serious about consistent performance across funded accounts, TradeDupe gives you the infrastructure to track, protect, and grow every account you manage.
Frequently asked questions
Why is real-time performance tracking essential for prop traders?
Real-time tracking allows you to catch issues and opportunities instantly across all accounts, greatly improving risk management and profit consistency. As financial firms monitor performance of proprietary trading activities, delays in data visibility can directly lead to account violations and missed risk signals.
How does automated trade duplication complicate metric tracking?
Automating trade copying multiplies data points and can mask discrepancies between accounts, so it's vital to track at both the master and sub-account levels. The performance-based trading evaluation process highlights how account-level metric granularity is what separates compliant operations from those at constant violation risk.
Which metric is the biggest red flag for prop trading risk?
Maximum drawdown highlights sudden or sustained losses, and 3% drawdown limits for 2026 have become the industry benchmark. If your maximum drawdown is growing, your trading strategy and risk controls should be reviewed immediately.
Can the same performance metrics be used for both evaluation and funded phases?
Yes, but in the funded phase, focus even more on consistency and risk-adjusted returns over headline profits. Metrics like Sharpe ratio and consistency score become more important once you're past evaluation and protecting real payouts.
What tool streamlines metric tracking for Tradovate-based prop firms?
TradeDupe offers automation and real-time dashboards tailored specifically for prop firms using Tradovate, making performance tracking straightforward across multiple accounts and firm integrations.
Recommended
- Prop Firm Consistency Rule Guide (2026): Topstep, Apex, Tradeify, MFFU Rules Explained | TradeDupe Blog
- Why Reliable Trade Execution Matters for Prop Firms | TradeDupe Blog
- Tradovate Trade Copier | Real-Time Account Sync | TradeDupe
- How to Trade Prop Firms (2026): A Practical Playbook to Pass and Keep a Funded Account | TradeDupe Blog