
Prop Trading Profit Split Structures: 2026 Guide
TradeDupe
11 min read
Discover what is profit split structure prop trading and how it impacts your earnings. Learn the industry benchmarks and maximize your profits.
A profit split in prop trading is the contractual percentage of net realized profits divided between a funded trader and the proprietary trading firm. The firm provides capital, technology, and risk infrastructure. You provide the trading skill. The split determines how much of each profitable dollar actually lands in your account.

The industry baseline sits at 80% to the trader and 20% to the firm on a new funded account. That 80/20 figure is not arbitrary. It reflects the firm's cost of absorbing losses from the broader pool of traders who fail evaluations, maintaining platform infrastructure, and processing payouts. Splits apply only to closed positions after platform fees and data costs are deducted. Floating equity on open trades counts for nothing until the position settles.
Key terms every trader should know before evaluating any funded offer:
- Net realized profit: Closed trade P&L minus platform fees, data subscriptions, and any commissions baked into the spread
- Payout cycle: The defined period (monthly, bi-weekly, or on-demand) over which profits accumulate before a split is calculated
- Scaling plan: A contractual mechanism that increases your split percentage after hitting defined performance milestones
- Drawdown limit: The maximum loss threshold; breaching it closes the account regardless of your split percentage
FTMO, one of the most established names in retail prop trading, starts traders at an 80% split and scales to 90% through its Scaling Plan after consistent performance. That structure has become the benchmark other firms are measured against.
Why profit split percentages differ across prop firms
No two firms price their splits identically, and the reasons go deeper than marketing. Profit splits vary based on a firm's risk management policies, the asset classes it supports, its evaluation fee model, and how aggressively it uses scaling to retain top performers.
- Risk management policies: Firms with tighter drawdown rules often offer higher headline splits because the risk of catastrophic trader losses is lower. Looser drawdown structures require the firm to absorb more downside, which can compress the trader's share.
- Asset class focus: Futures-focused firms like Topstep operate in a different risk environment than forex or CFD firms. CME-listed products carry exchange-mandated margin requirements, which shapes how firms structure their capital exposure and, in turn, their split economics.
- Evaluation fee structure: Firms that charge higher upfront challenge fees can sometimes offer more generous splits because they recover infrastructure costs before a trader reaches a funded account.
- Scaling model design: Firms that reward consistency over time use scaling plans to keep their best traders engaged long-term, gradually increasing splits as a retention tool instead of only offering a high flat rate from day one.
- Business model balance: Some firms treat evaluation fees as the primary revenue stream and use profit splits as a secondary income. Others invert this, keeping splits lower but charging minimal evaluation fees.
Understanding which model a firm uses tells you a lot about its incentives and whether its interests align with yours as a trader.
What are the main types of profit split structures?
The prop trading industry has converged on a handful of distinct models, each with different implications for your actual take-home pay.
- Fixed flat split: The simplest structure. You receive the same percentage from your first payout to your last, regardless of performance history. An 80/20 flat split is the most common starting point across the industry. Predictable, but offers no upside for consistent performers.
- Tiered split by account size: Your percentage is determined by the account tier you purchase, not by how long you have traded. A firm might offer 80% on a $50,000 account and 90% on a $100,000 account from day one. This rewards capital commitment rather than performance.
- Performance-based scaling split: The split increases as you hit defined milestones. FTMO's Scaling Plan moves traders from a base split to a higher level after achieving consistent net profits over multiple months with at least two profitable months. This model aligns the firm's incentives with yours.
- First-payout bonus structure: Several futures firms front-load the split. Apex Trader Funding offers 100% on the first $25,000 per account, then reverts to 90/10. Tradeify offers 100% on initial payouts up to $15,000. These bonuses are real but time-limited.
- Frequency-based split: A newer model where the split changes based on how often you withdraw. Waiting longer between payouts earns a higher percentage per dollar. This rewards patience and discourages impulsive withdrawals.
- Promotional 100% splits: Some firms advertise 100% splits as a marketing campaign for the first payout cycle. These are not unconditional. The firm recovers its costs through evaluation fees and the retained splits from traders at lower tiers.
A higher headline split is not automatically a better deal. A 90/10 firm with a 1% daily drawdown and monthly-only payouts may offer less favorable conditions in practice than an 80/20 firm with bi-weekly payouts and a 5% trailing drawdown. The split is one variable in a multi-factor equation.
How profit splits affect your actual earnings and incentives
The gap between a firm's advertised split and your real take-home pay is where most traders get surprised. Evaluation fees deducted from the first payout materially reduce the effective split during cycle one, a cost that rarely appears in marketing materials.
- First-payout fee deductions: If you paid $200 for a challenge and your first payout is $1,000 at an 80% split, your net is $600, not $800. The effective split on that cycle is 60%, not 80%.
- Payout frequency and cash flow: Monthly payouts mean capital sits locked in the account longer. Bi-weekly or on-demand structures give you faster access to realized gains, which matters for compounding and liquidity.
- Scaling plan incentives: Firms that tie split increases to consecutive profitable months create a powerful behavioral incentive. Traders who might otherwise withdraw aggressively learn to manage consistency targets, which tends to produce more disciplined risk management.
- Drawdown rules limiting payout eligibility: A trader can generate strong gross returns but still fail to qualify for a payout if a single losing day breaches the daily drawdown limit. The split percentage becomes irrelevant if you cannot reach the payout threshold.
- Gross vs. net profit misconception: The most common error is assuming the headline split applies to gross profits. Most firms calculate the split on net profits after deducting platform fees, data feeds, and commissions. Your actual take-home is lower than the advertised percentage suggests.
Pro Tip: Before committing to any challenge fee, read the payout clause in full. Specifically look for whether the evaluation fee is deducted from the first payout, what the minimum profit threshold is before a payout is approved, and whether consistency rules apply to payout eligibility.
Understanding how prop firm rules affect trade copying is equally relevant here. Payout conditions and drawdown rules directly shape which trades you can hold and when you can close them.

What to evaluate beyond the headline split percentage
Choosing a prop firm based on the advertised split alone is like choosing a mortgage based on the monthly payment without reading the interest rate. The headline number is the starting point, not the conclusion.
- Evaluation difficulty relative to fees: A firm charging $500 for a challenge with a 10% profit target and a 4% trailing drawdown is structurally harder than one charging $150 with an 8% target and a 5% fixed drawdown. The split percentage means nothing if the evaluation is designed to fail most traders.
- Drawdown type and depth: Fixed drawdowns (calculated from starting balance) are more forgiving than trailing drawdowns (which follow your equity high). Two firms can both offer 90% splits with completely different risk environments underneath.
- Payout frequency and processing time: On-demand payouts processed within 24 hours give you fundamentally different cash flow than monthly payouts with a 5-business-day processing window.
- Scaling plan specifics: Not all scaling plans are equal. FTMO's plan is time-gated and performance-gated, requiring four months of trading and a 10% net profit threshold. Other firms use capital milestones. Know exactly what triggers your split increase before you sign up.
- Firm track record and payout reliability: FTMO has funded over 200,000 traders since 2015 with a reported 99.8% on-time payout rate. That history matters when evaluating whether a firm's advertised split will actually be honored at scale.
- Retail vs. institutional split models: Retail prop firms apply splits per payout cycle with no high-water mark beyond drawdown rules. Institutional desks use performance fees tied to a high-water mark and often a hurdle rate, meaning the trader only earns the split on returns above a benchmark.
For a direct comparison of prop firm vs. personal account economics, the key distinction is risk transfer. Personal accounts keep 100% of profits but expose your own capital to losses. Prop firms absorb losses in exchange for their percentage of your gains.
How profit splits function as risk-sharing mechanisms
The profit split is not just a compensation formula. It is the commercial architecture that makes the entire prop trading model viable for both sides.
- Net realized profit only: Splits apply exclusively to closed positions net of fees. Open floating equity is excluded from payout calculations entirely. A trader sitting on $8,000 in unrealized gains cannot withdraw until those positions close.
- First-payout deductions reduce effective splits: Challenge fees deducted from cycle one payouts lower the real percentage a trader receives on initial earnings. This is a structural feature of most retail prop firms, not an exception.
- Scaling plan thresholds lock traders at base splits: Consistent profitability thresholds such as 10% net profit over four months with at least two profitable months must be met before a split increase triggers. Missing these criteria keeps traders at the base rate indefinitely, regardless of overall account growth.
- Firms absorb all trading losses: The firm's share of profits is not pure margin. It covers the losses absorbed from funded accounts, infrastructure costs, and the payout processing for the minority of traders who reach consistent profitability.
- 100% splits are subsidized by fees: Firms offering 100% splits generate revenue through evaluation fees, monthly subscriptions, or add-on purchases. The 100% tier is a reward structure within a broader business model, not a charitable arrangement.
> Industry baseline: The 80/20 split is the standard starting point across major retail prop firms, with scaling plans commonly pushing splits to 90/10 after sustained performance. A small number of firms run promotional 100% splits for initial payout cycles, though these are typically time-limited or milestone-gated rather than permanent structures.
The firm's retained share covers infrastructure, risk absorption, and the cost of funding traders who generate losses. Viewed through that lens, the 20% the firm keeps on an 80/20 split is not a fee. It is the price of accessing capital you did not have to risk yourself.
How your profit split evolves as you trade longer
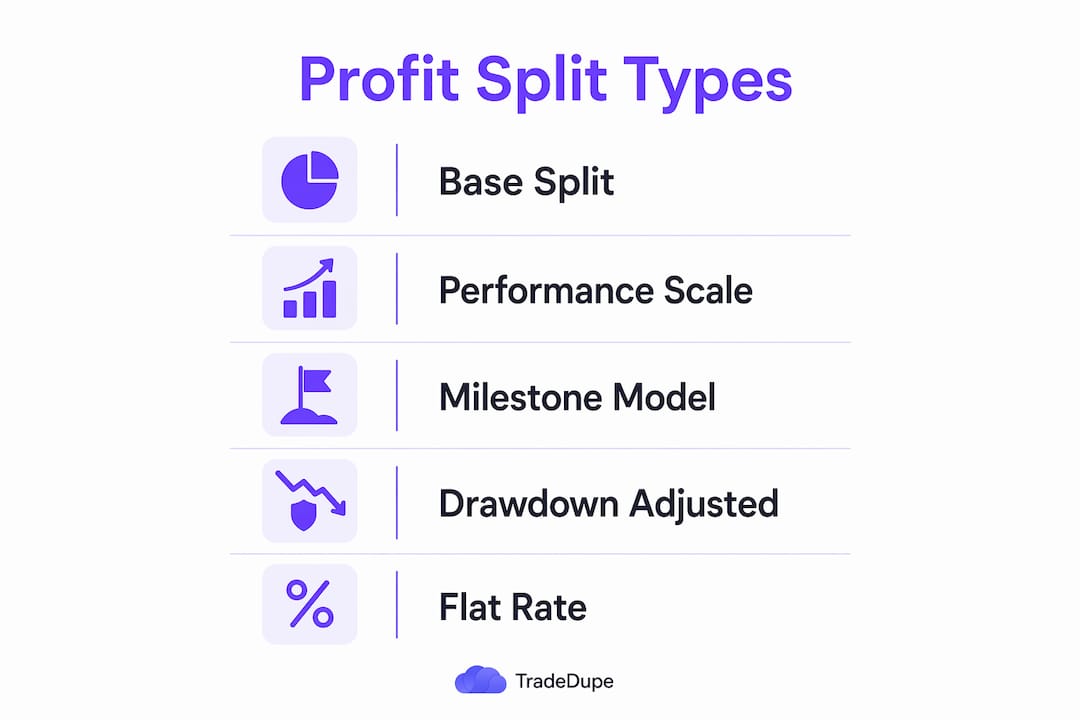
Profit split structures are not static. For traders who stay funded and hit performance targets, the split percentage tends to move in one direction: up.
The most common evolution path runs from a base split favoring the trader substantially to a higher split through a documented scaling plan. FTMO's version requires several months of funded trading, a net profit threshold, and at least two profitable months within that window. Meeting these marks triggers an increase in account balance and split percentage. The maximum funded account size under FTMO's standard plan reaches $2,000,000.
Milestone-based models work differently. Rather than time-gating the increase, they tie split progression to account balance thresholds. A trader might start at 80% and reach 85% after growing the account to a defined capital level, then 90% at the next tier, and eventually 100% at the top. This structure rewards capital growth rather than calendar consistency.
Downward changes are less common but possible. Breaching a soft rule such as a consistency requirement or minimum trading days can reset the account or revert the split to the base rate. The contractual terms governing both upward and downward changes should appear in the funded account agreement, not in a support ticket or verbal communication from the firm.
For traders managing multiple funded accounts simultaneously, using a prop firm profit calculator to model split progression across different scaling scenarios helps clarify which firm's structure actually compounds in your favor over a 12-month horizon.
The practical takeaway: a firm offering 80% with a clear, achievable scaling path to 90% or higher is often more valuable than one offering a flat 90% with no progression mechanism. The split you can grow into tends to matter more than the split you start with.
Key Takeaways
Prop trading profit splits are calculated on net realized profits only, making the full payout structure, including drawdown rules, scaling triggers, and fee deductions, more important than the headline percentage alone.
| Point | Details |
|---|---|
| Industry baseline split | Most retail prop firms start traders at 80/20, with scaling plans reaching 90/10 after sustained performance. |
| Net profit calculation | Splits apply only to closed positions after platform fees and data costs are deducted; floating equity is excluded. |
| First-payout fee deductions | Challenge fees deducted from the first payout lower the effective split on cycle one, often materially. |
| Scaling plan requirements | FTMO's plan requires 10% net profit over four months with at least two profitable months before a split increase triggers. |
| 100% splits have conditions | Firms offering 100% splits generate revenue through evaluation fees or subscriptions; the 100% tier is milestone-gated, not unconditional. |
*
Tradedupe is built for prop traders who manage multiple funded accounts on Tradovate and need real-time trade mirroring with median 34ms latency. Whether you are running Apex, Tradeify, Lucid Trading, or Alpha Futures accounts, Tradedupe replicates your lead account across all follower accounts automatically, with rogue-trade detection and per-account toggle controls keeping your risk management intact.
If you are scaling across multiple funded accounts and want execution that keeps pace with your profit split targets, start with Tradedupe today.