Trade Exposure Across Accounts: Prop Desk Control Guide
TradeDupe
11 min read
Discover what is trade exposure across accounts and learn effective controls for mitigating aggregated risk in your trading strategy.
Trade exposure across accounts is the total aggregated USD-notional risk created when identical or correlated positions run simultaneously across multiple mirrored Tradovate accounts — the precise pattern PropFirmScan flags as a systemic audit risk and the core problem Tradedupe's mirroring controls are built to contain. Your first three moves: convert every open position to USD notional, compare net exposure (longs minus shorts) against gross exposure (longs plus shorts) at the account-group level, and run a quick heat check across your correlation buckets.
The sections below cover the exact metrics, a worked shock-test calculation, mitigation controls, and how Tradedupe's Tradovate integration maps to each step.
*
Table of Contents
- What is trade exposure across accounts, and why does it matter for prop desks?
- Core exposure metrics every mirrored-account desk must track
- Why correlated mirrored positions create systemic drawdown risk
- How to measure cross-account exposure step by step
- Operational controls that reduce systemic cross-account exposure
- How Tradedupe maps mirroring controls to exposure management on Tradovate
- Daily monitoring routine and incident response playbook
- Key Takeaways
- A prop-desk operator's honest take on cross-account exposure
- Tradedupe gives prop desks real-time exposure control on Tradovate
- Useful sources and further reading
What is trade exposure across accounts, and why does it matter for prop desks?
Cross-account exposure is not simply the sum of each account's individual P&L risk. When a leader account mirrors identical futures positions into five follower accounts simultaneously, the desk holds five correlated bets on the same underlying — and a single adverse move hits all five at once. PropFirmScan's guidance on multi-firm risk makes this explicit: normalizing to USD notional and grouping by correlation buckets is the only way to see true portfolio heat.

The distinction between net exposure and gross exposure is where most prop desks underestimate their risk. Net exposure tells you directional bias; gross exposure tells you total capital deployed. A desk that appears flat on a net basis can still carry enormous gross exposure if it holds offsetting longs and shorts across accounts — and that gross figure is what drives drawdown when volatility spikes.
*
Core exposure metrics every mirrored-account desk must track
Four fields form the foundation of any cross-account exposure view, modeled on the field structure the ScaleTrade TCP API returns per login:
- buy_exposure_usd: Total USD notional of all long positions across accounts.
- sell_exposure_usd: Total USD notional of all short positions across accounts.
- net_exposure_usd: buy_exposure_usd minus sell_exposure_usd — your directional bias in USD.
- gross_exposure_usd: buy_exposure_usd plus sell_exposure_usd — total capital at work, regardless of direction.
Converting to USD notional rather than lot counts is non-negotiable. A one-lot position in gold carries a very different notional value than a one-lot position in a micro-FX contract. Comparing lot counts across instruments misstates absolute market risk in ways that can be catastrophic at scale.
| Symbol | buy_exposure_usd | sell_exposure_usd | net_exposure_usd | gross_exposure_usd |
|---|---|---|---|---|
| GC | — | — | (—) | — |
| Total | — | — | $135,000 | $275,000 |
> Key insight: A desk showing $135,000 net exposure looks manageable — until you see $275,000 gross. That $140,000 gap represents positions that cancel on paper but draw down simultaneously in a correlated shock.
Pro Tip: When your monitoring platform exposes LP coverage rows — fields like `coverage_buy_exposure_usd` and `coverage_sell_exposure_usd` — subtract covered volume from gross exposure to get your true unhedged market risk. The ScaleTrade API pattern is a useful implementation reference for building this view.
*
Why correlated mirrored positions create systemic drawdown risk
Mirrored accounts do not diversify risk — they concentrate it. When a single leader account drives five followers into the same ES long, the desk's effective position is five times the notional of one account. A 2% adverse move on ES hits every account's drawdown counter simultaneously, and max-drawdown rules at prop firms like Apex or Tradeify trigger on a per-account basis. Five accounts breaching their limits in the same session is an operational and compliance event, not just a bad trade.
Stackorithm's analysis of cross-account hedging identifies three audit signals that risk engines look for at the network level:
- Timing correlation: Entries and exits across accounts occurring within milliseconds of each other.
- Proportional sizing: Position sizes that maintain a fixed ratio across accounts — a clear fingerprint of automated mirroring.
- Overlap duration: Correlated positions held open for identical time windows across multiple accounts.
> Audit reality: These patterns only become visible when accounts are reviewed together. A single-account view passes compliance; the network view flags it immediately.
Pro Tip: Stagger your entry timing across follower accounts and vary sizing ratios slightly where your prop firm's rules permit. Identical timestamps and identical lot counts are the two fastest ways to trigger a structured-offset review.
The copy trading multi-account benefits that make mirroring attractive — speed, consistency, scale — are the same properties that create concentrated exposure when left unmanaged.
*
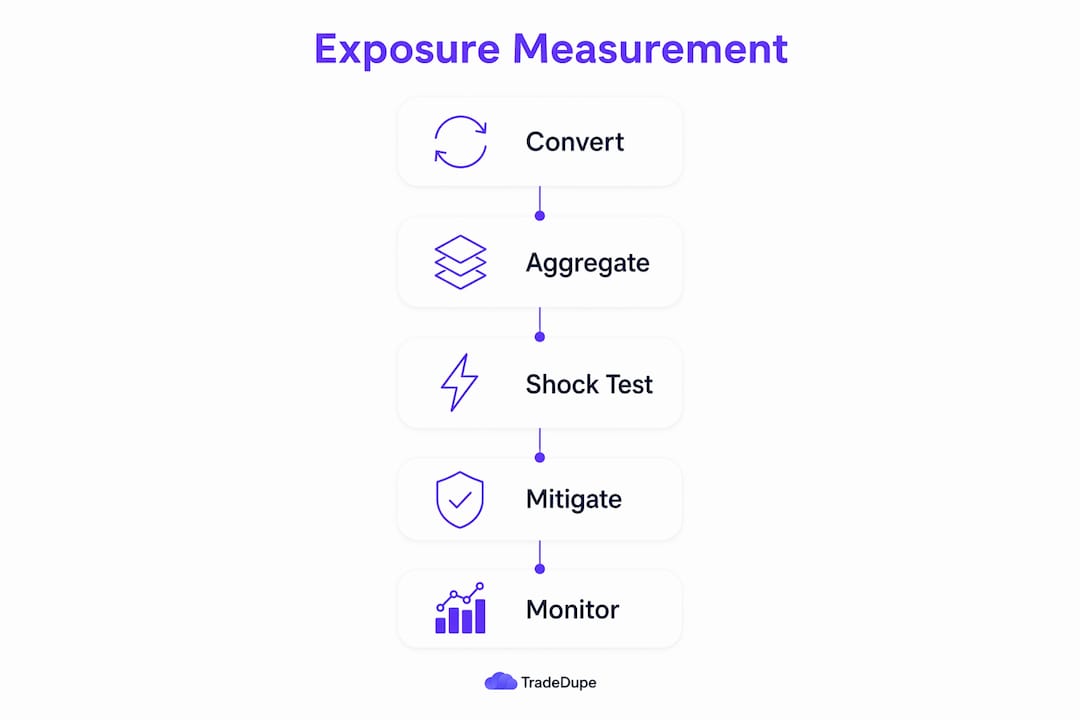
How to measure cross-account exposure step by step
Follow this procedure at the start of each session and after any significant market move.
- Extract all open positions from every leader and follower account in your Tradovate group.
- Convert each position to USD notional using current market price times contract multiplier times number of contracts.
- Group positions by symbol and correlation bucket (e.g., equity index futures together, metals together, energy together).
- Sum buy_exposure_usd and sell_exposure_usd within each bucket across all accounts.
- Calculate net and gross exposure per bucket and in aggregate.
- Run a shock test: Apply a 2% adverse move to your largest gross exposure bucket and calculate the total equity impact across all accounts.
Worked shock-test example including a representative adverse S&P move:
| Account | ES Contracts | Notional (USD) | 2% Shock Impact |
|---|---|---|---|
| Leader | 2 | — | — |
| Follower 1 | 2 | — | — |
| Follower 2 | 2 | — | — |
| Follower 3 | 1 | — | — |
That combined drawdown hits simultaneously. If each account carries a daily drawdown limit around typical margin sizes, multiple accounts can breach their limits in a single move.
> Measurement cadence: Run full exposure aggregation at session open, at midday, and immediately after any position change exceeding 20% of your gross exposure baseline. Automate it — manual checks at these frequencies are not sustainable across more than three accounts.
Pro Tip: When accounts are denominated in different currencies or carry different margin treatments, convert each position's notional to USD at the current spot rate before aggregating. Never mix lot-count math with notional math in the same exposure table.
*
Operational controls that reduce systemic cross-account exposure
Effective risk management at the desk level combines hard limits, behavioral rules, and platform automation.
Hard limits to set before each session:
- Per-account notional cap by symbol (e.g., no single account exceeds $50,000 gross in any one instrument).
- Maximum concurrent gross exposure across all accounts as a percentage of total combined capital.
- Per-symbol concentration limit: no single instrument exceeds 40% of total gross exposure.
Behavioral rules that reduce audit flags:
- Time-stagger follower entries by at least one order-routing cycle where firm rules allow.
- Avoid identical sizing ratios across all followers — vary by account size or risk tier.
- Never run reverse trades across accounts at different firms to manufacture an offset; this is the pattern Stackorithm describes as the clearest audit trigger.
Automation controls:
- Rogue-trade kill switches that halt mirroring if a follower account deviates from the leader's position by more than a defined threshold.
- Per-account toggle controls to pause individual followers without stopping the leader.
- Auto-recovery logic that re-syncs a follower after a connectivity drop without creating duplicate positions.
Immediate containment checklist when exposure is high:
- Pause mirroring to all follower accounts via per-account toggles.
- Flatten the highest gross-exposure positions in the leader account first.
- Verify each follower's position matches the leader before re-enabling mirroring.
- Log the event with timestamps for audit trail purposes.
*
How Tradedupe maps mirroring controls to exposure management on Tradovate
Tradedupe's architecture for Tradovate users surfaces the telemetry that exposure management requires. Median mirroring latency of 34ms means follower positions open close enough to the leader's fill to avoid meaningful slippage-driven exposure divergence. Sync-status dashboards show per-follower connection health in real time, so a dropped follower does not silently accumulate an unhedged position.
| Control | Operational benefit | Tradedupe feature |
|---|---|---|
| Per-account toggle | Pause one follower without disrupting others | Per-account enable/disable in dashboard |
| Rogue-trade detection | Catches follower positions that diverge from leader | Automated deviation alerts |
| Auto-recovery | Re-syncs follower after disconnect without duplicates | Built-in reconnect logic |
| Sync-status dashboard | Real-time view of leader/follower health | Live sync monitor |
| Audit logs | Evidence collection for post-incident review | Timestamped trade and event logs |
Tradovate-specific integration note: Tradovate reports positions in contracts, not notional. Convert to USD notional before aggregating across accounts — do not compare raw contract counts across instruments. Tradedupe's trade copier architecture handles the Tradovate API layer, but notional conversion for exposure reporting sits in your risk dashboard, not the mirroring layer.
Pro Tip: Pull Tradedupe's sync-status and latency data into your daily risk dashboard alongside your exposure aggregation. A follower showing elevated latency is a leading indicator of position divergence — catch it before it becomes an unhedged exposure.
*
Daily monitoring routine and incident response playbook
Daily workflow (run at session open):
- Pull the top-10 symbols by gross_exposure_usd across all accounts.
- Check net vs. gross trend versus the prior session — widening gross with flat net signals growing hidden risk.
- Review sync health for all follower accounts in Tradedupe's dashboard.
- Confirm no follower carries a position the leader does not hold.
Incident response — exposure spike or suspicious pattern detected:
- Immediately pause mirroring to affected follower accounts via per-account toggles.
- Run a cross-account correlation scan: compare entry timestamps, sizing ratios, and overlap durations.
- Throttle the leader account's position size until the investigation is complete.
- Document all positions, timestamps, and account states at the moment of detection.
- Escalate to your compliance or risk auditor if timing correlation or proportional sizing patterns are confirmed.
> Evidence standard: A defensible post-incident review requires timestamped logs of every order, fill, and sync event across all accounts. Collect these before closing any positions — post-hoc reconstruction from memory does not satisfy a prop firm's audit request.
Pro Tip: Tradedupe's audit trail guidance covers the specific log fields and export formats that satisfy common prop firm review requests. Automate log export at session close so evidence is always available without manual intervention.
*
Key Takeaways
Cross-account trade exposure is a network-level metric — single-account views hide the correlated risk that triggers simultaneous drawdowns and audit flags across mirrored Tradovate accounts.
| Point | Details |
|---|---|
| Define exposure in USD notional | Convert all positions to USD notional before aggregating; lot counts across instruments misstate absolute risk. |
| Track net and gross separately | Net exposure shows directional bias; gross exposure shows total capital deployed and true drawdown potential. |
| Shock-test every session | Model an adverse move on your largest gross-exposure bucket to see simultaneous drawdown across all accounts. |
| Audit signals are network-level | Timing correlation, proportional sizing, and identical overlap duration only appear when accounts are reviewed together. |
| Tradedupe provides the controls | Per-account toggles, rogue-trade detection, auto-recovery, and sync dashboards map directly to each mitigation step above. |
*
A prop-desk operator's honest take on cross-account exposure
Most prop desks underestimate cross-account exposure because their risk tools are built for single accounts. The metrics look fine at the account level. The problem lives one layer up, at the network level, where correlated positions accumulate silently until a volatility event forces them all into drawdown simultaneously.
The behavioral changes that matter most are not technical. Staggering entries, varying sizing ratios, and keeping clean audit logs are habits, not features. A platform can surface the data; the desk has to act on it. What Tradedupe adds is the infrastructure that makes acting on it fast enough to matter — 34ms mirroring latency, per-account toggles you can throw in seconds, and logs that are already formatted for a prop firm's review process. The desks that institutionalize a daily exposure review and automate their evidence collection are the ones that scale without accumulating compliance debt.
*
Tradedupe gives prop desks real-time exposure control on Tradovate
The single sharpest advantage Tradedupe delivers is speed with accountability: futures trade mirroring at 34ms median latency, paired with per-account toggles and rogue-trade detection that let you contain an exposure spike in seconds rather than minutes.
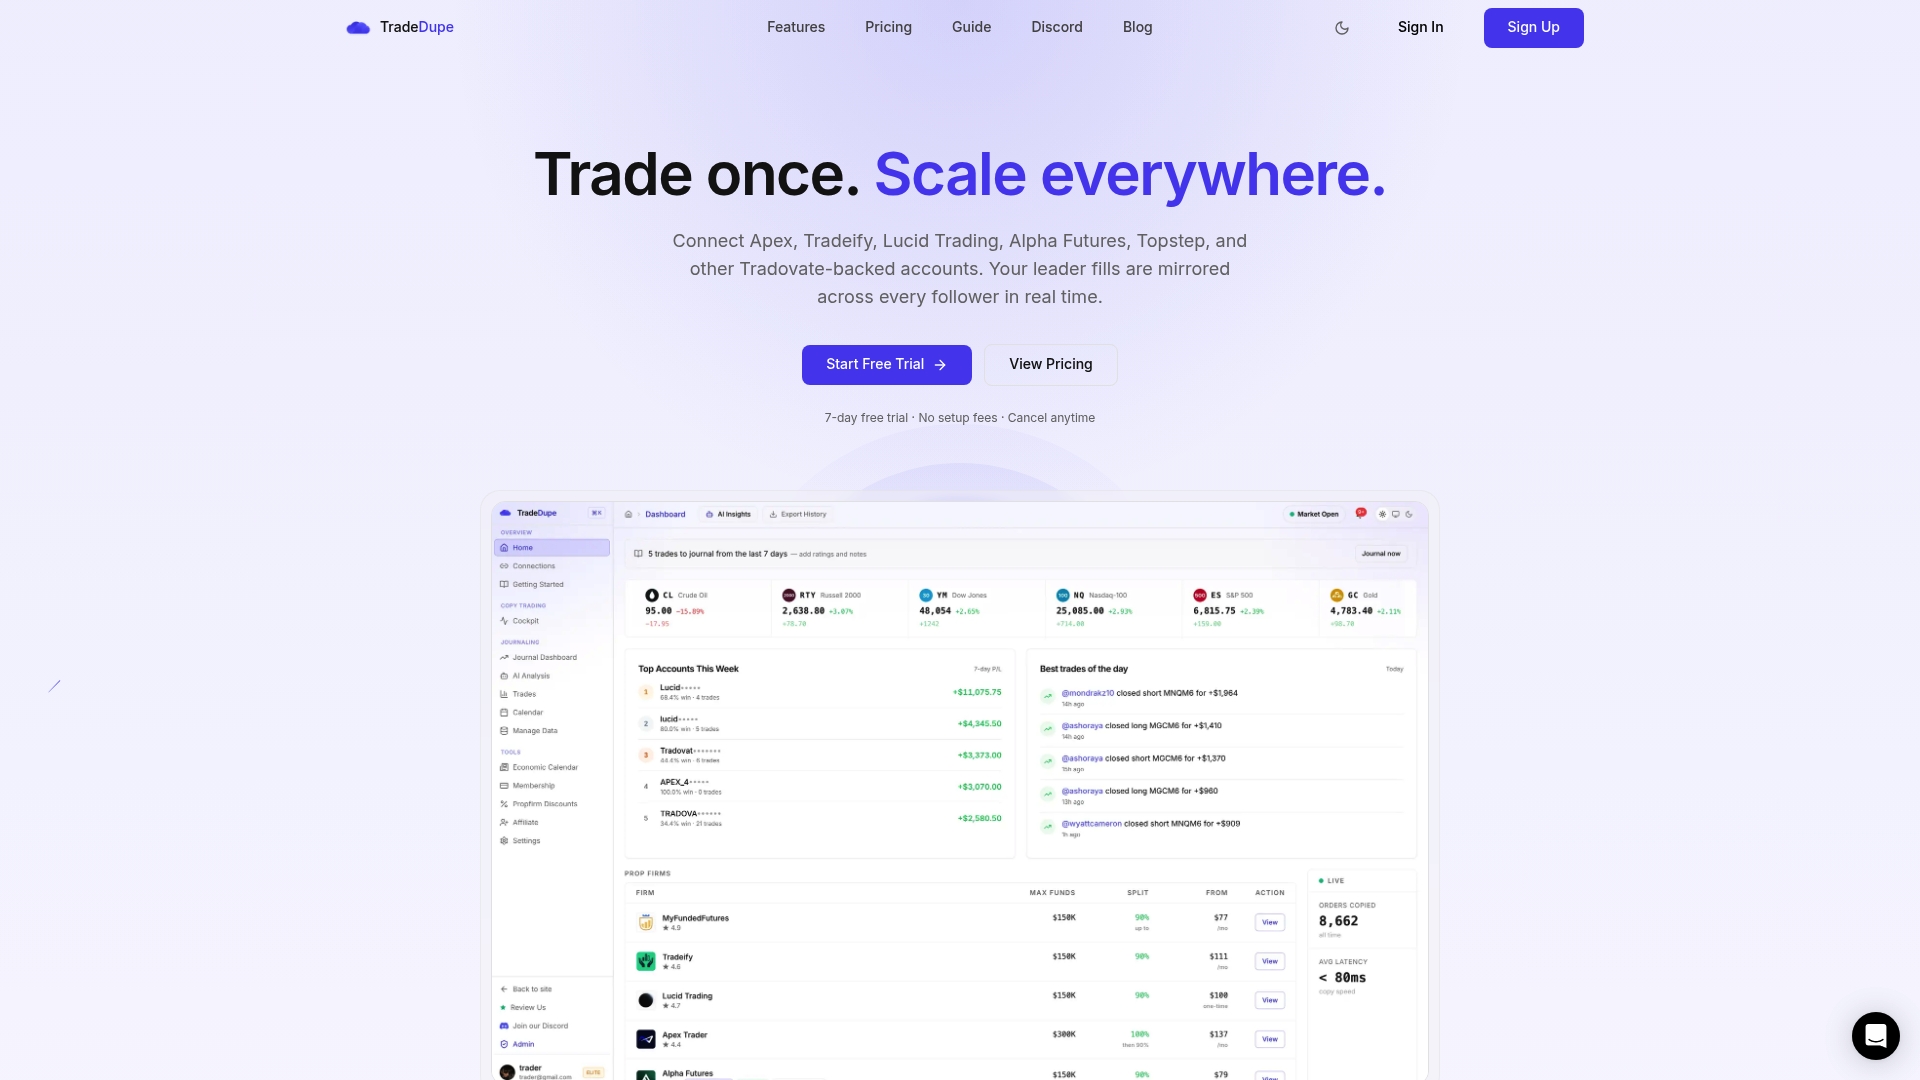
Risk teams evaluating a mirror platform should ask four questions: What is the median mirroring latency? Does the platform provide per-account pause controls without stopping the leader? Are audit logs timestamped and exportable in a format prop firms accept? Does the sync-status dashboard show follower health in real time? Tradedupe answers all four for Tradovate users, with integrations covering Apex, Tradeify, Lucid Trading, and Alpha Futures accounts.
Get started with Tradedupe to see the exposure dashboards, sync-status monitors, and per-account controls in a live environment — setup takes under ten minutes.
*
Useful sources and further reading
- PropFirmScan — Multi-firm asset correlation guide: Primary reference for USD notional normalization, correlation buckets, and portfolio heat visualization. Contains the heat-map methodology used in the daily workflow section above.
- ScaleTrade TCP API — GetExposureByLogin: Documents the buy_exposure_usd, sell_exposure_usd, net_exposure_usd, gross_exposure_usd, and LP coverage fields used as the metric standard throughout this guide.
- Stackorithm — Cross-account hedging and manual risk analysis: Explains timing correlation, proportional sizing, and overlap duration as the three audit signals that continuous detection systems look for at the network level.
- insightsoftware — Trade exposure definition: Grounds the general trade exposure definition and links it to stress testing and hedging strategy rationale.
- Allianz Trade — Trade risk management strategies: Overview of contingency planning and hedging approaches applicable to organizations managing macro and market shocks.
> Implementation note: The ScaleTrade API documentation is the most directly applicable technical reference for desks building their own exposure aggregation layer. The PropFirmScan guide is the best starting point for risk teams designing correlation-bucket frameworks and heat-map dashboards.